Web Dashboard and Workspace
A Nord-styled browser control plane for Cacophony operators.
The caco-web service serves the overview dashboard and the /workspace MVP. Both are daemon clients: they load snapshots from the local daemon, subscribe to SSE updates, and open terminal panes through first-party agent PTY endpoints rather than talking directly to tmux or remote daemons.
caco ui launches the same dashboard in a co-installed Tauri desktop shell on Linux and macOS. The native app owns a loopback dashboard process for its lifetime, adds native window and keyboard integration, and does not require a separately launched caco web.
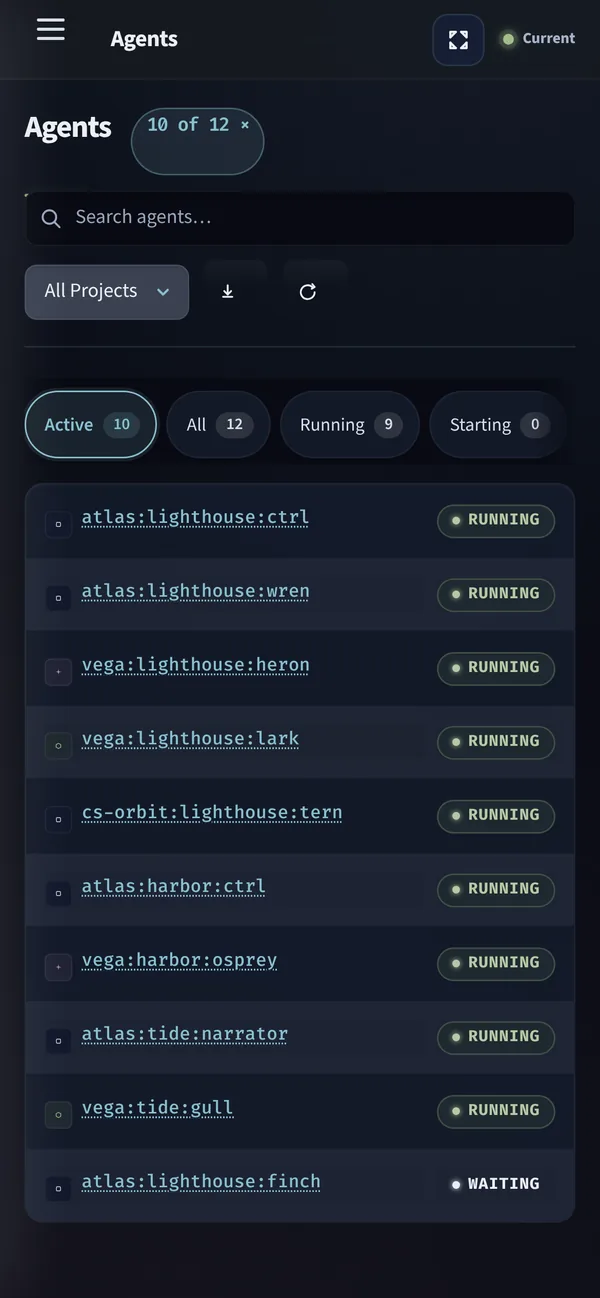
Visual changes are reviewed against deterministic fixture captures: scripts/caco-web-ui-capture.sh renders every view at desktop, tablet, ultrawide and phone sizes and in each theme, without contacting a live daemon.
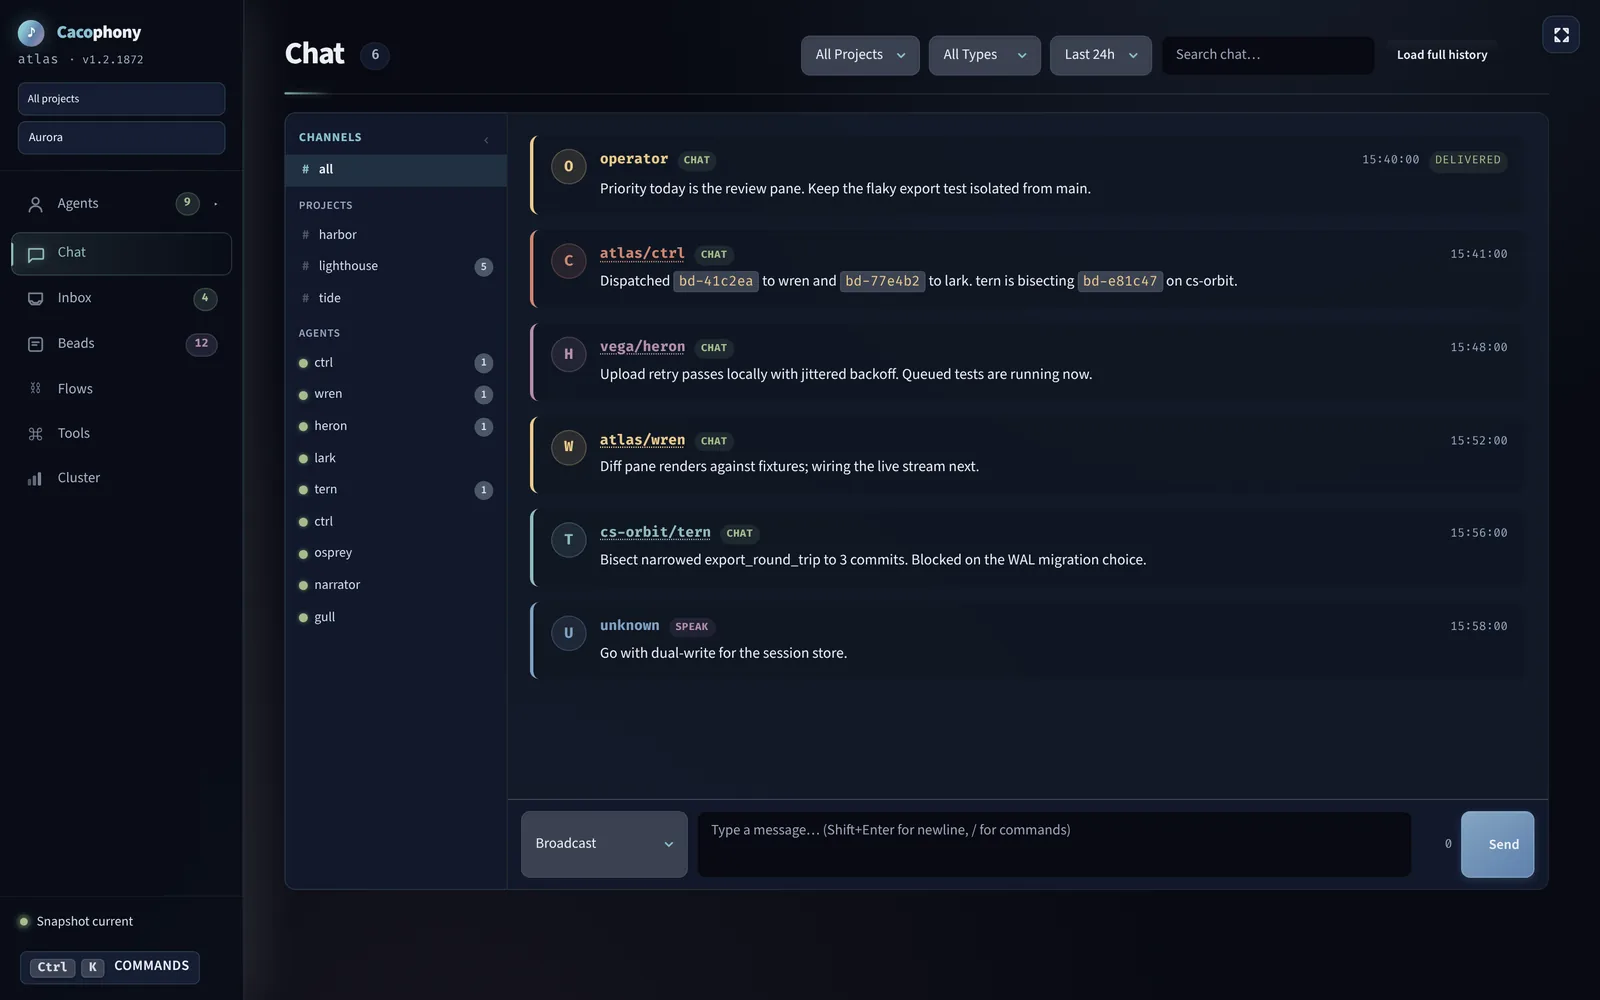
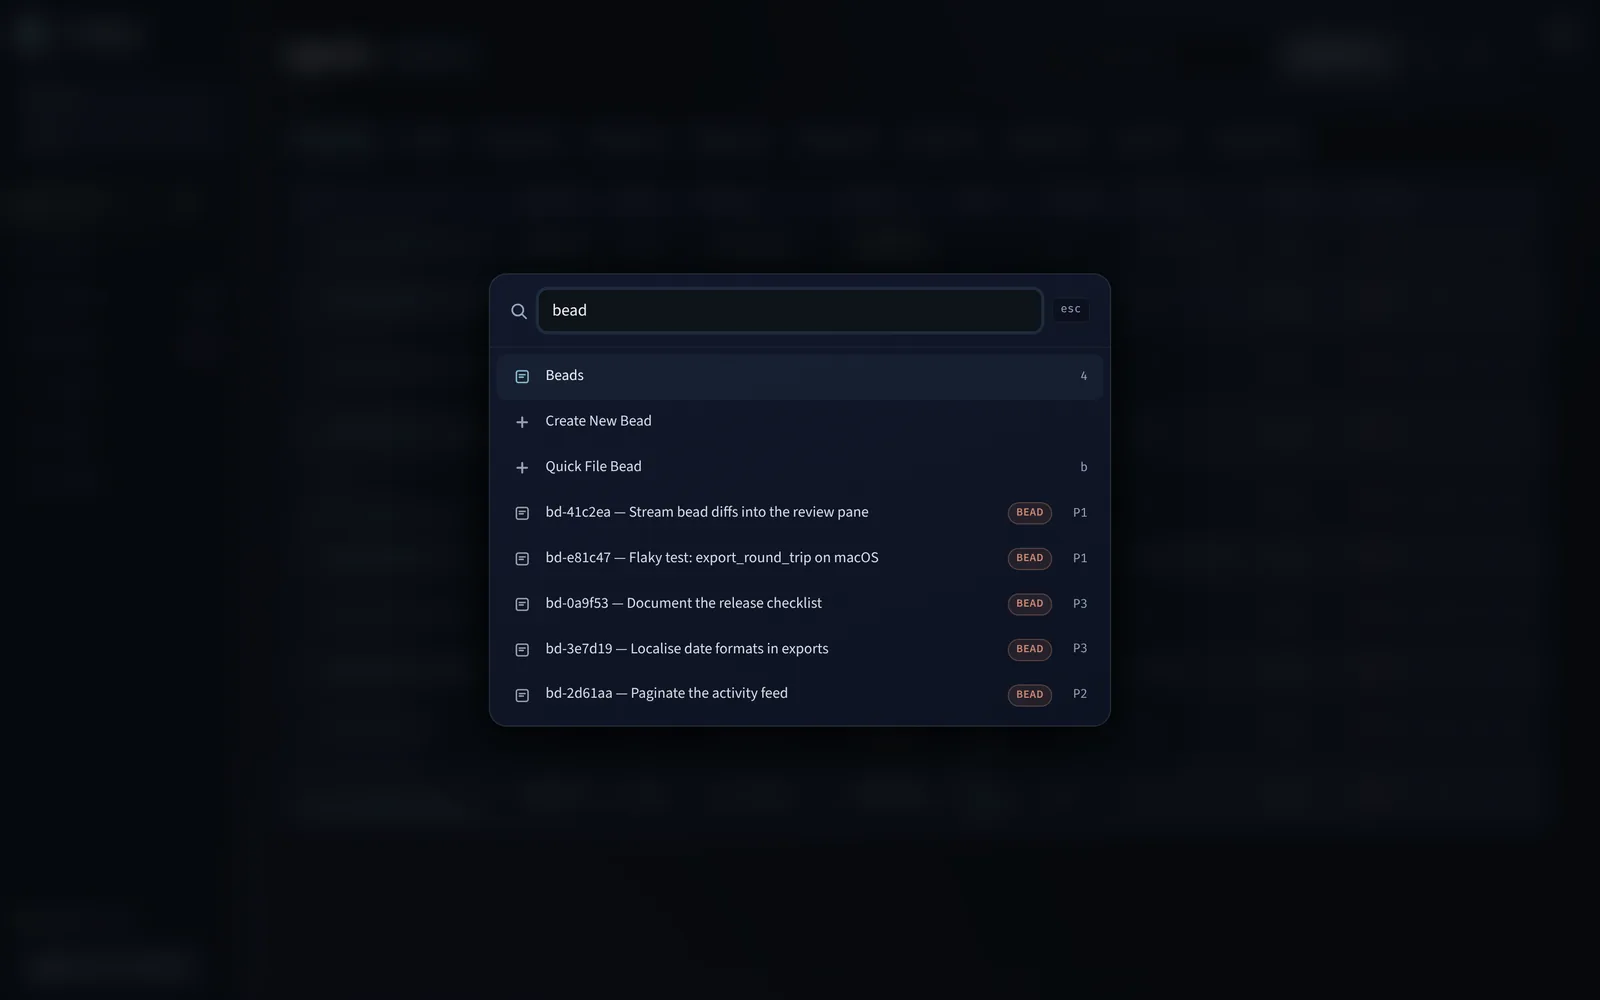
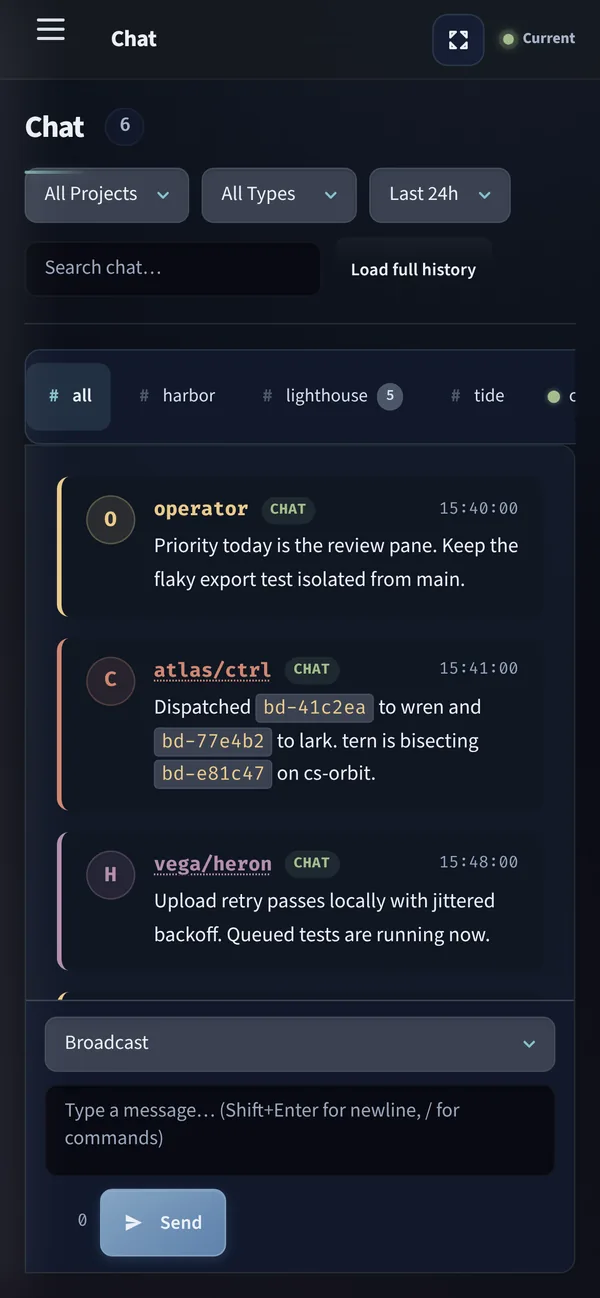
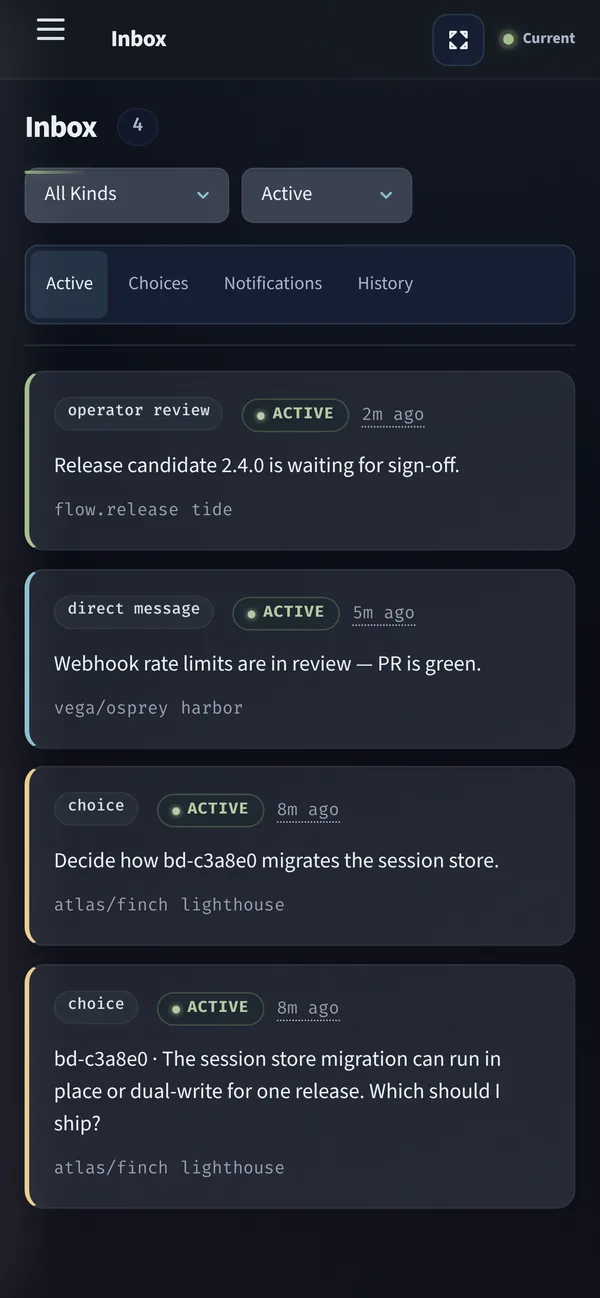
The dashboard
Captured from a synthetic three-node demo fleet.
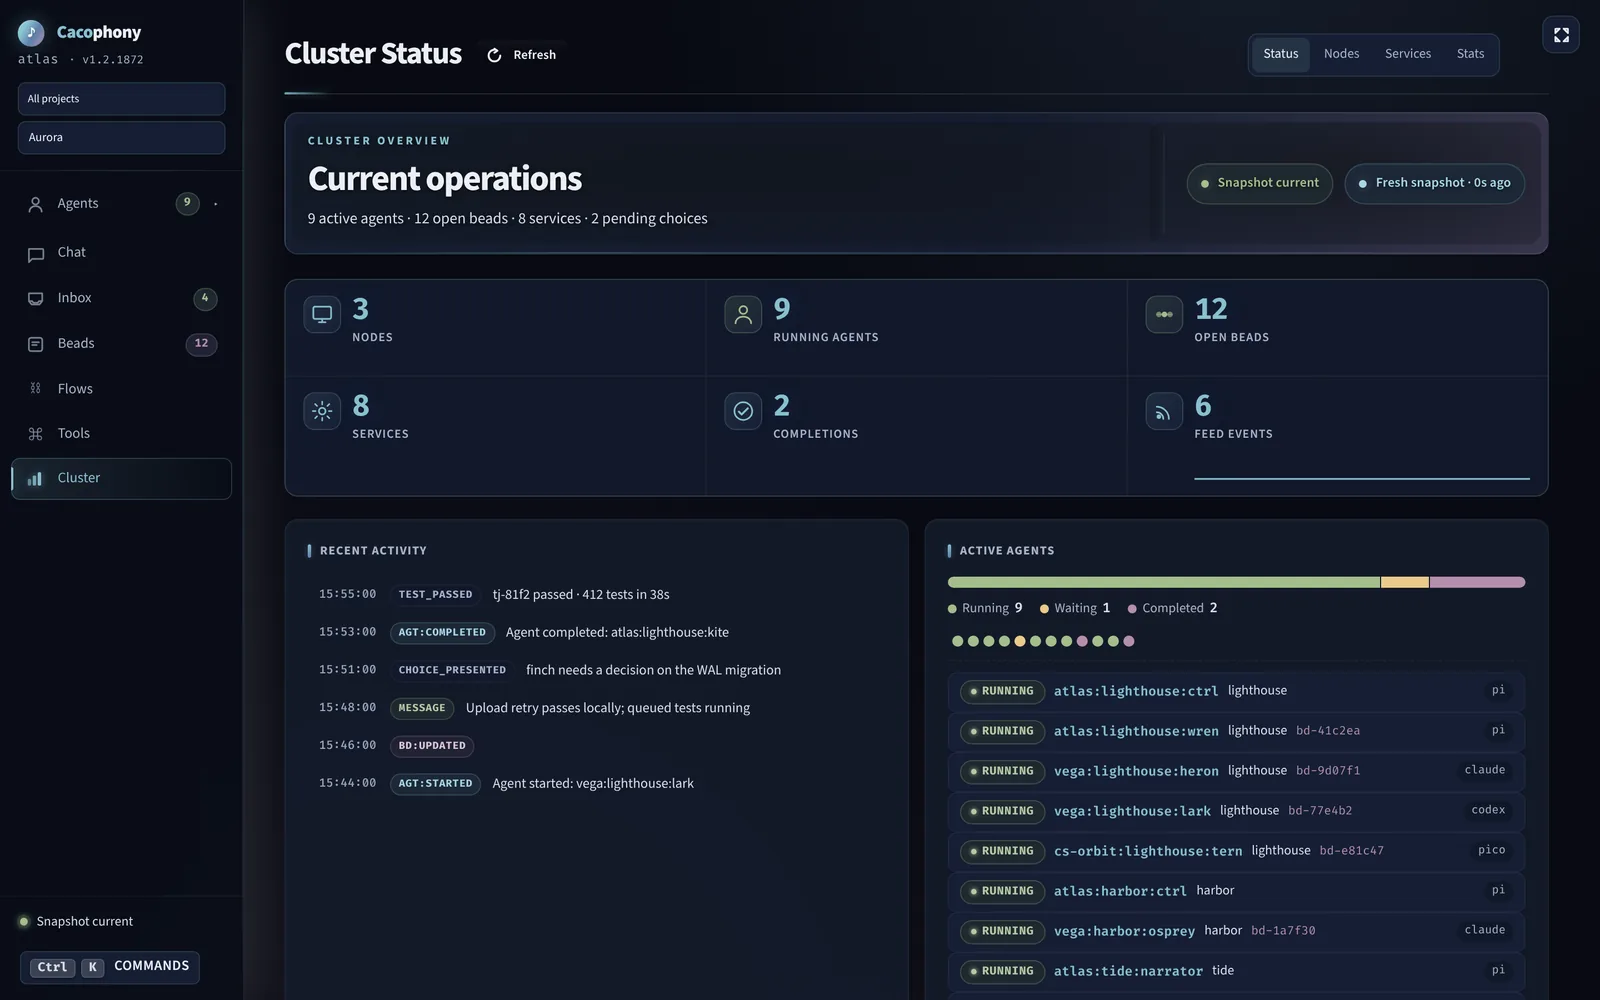
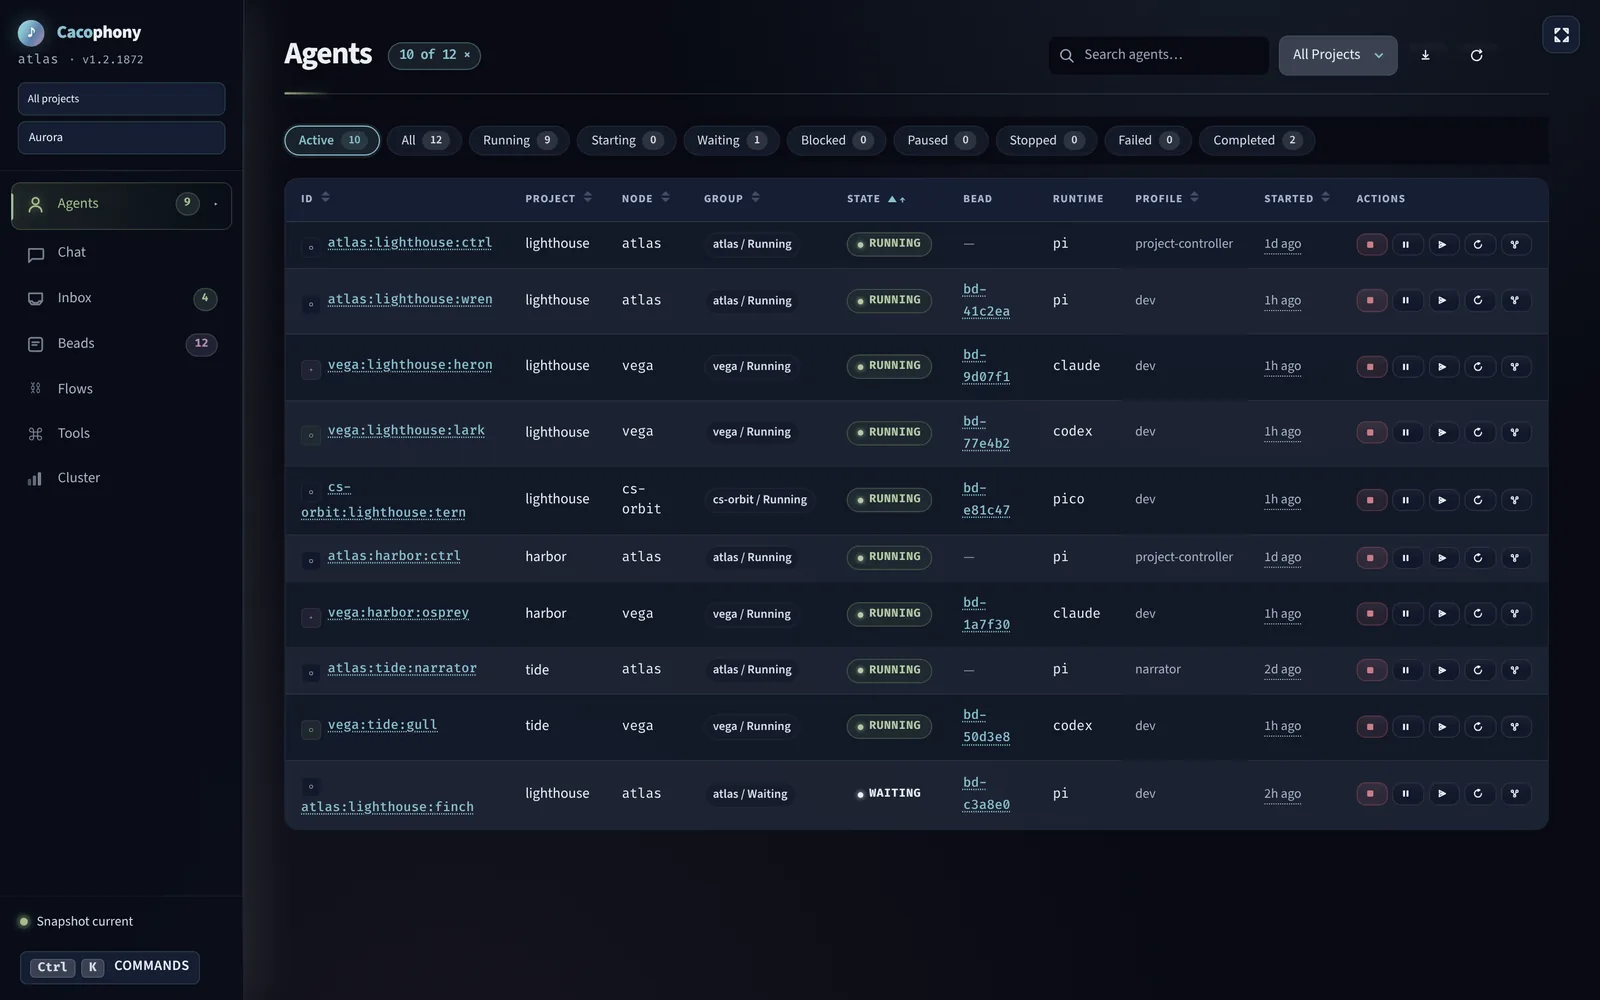
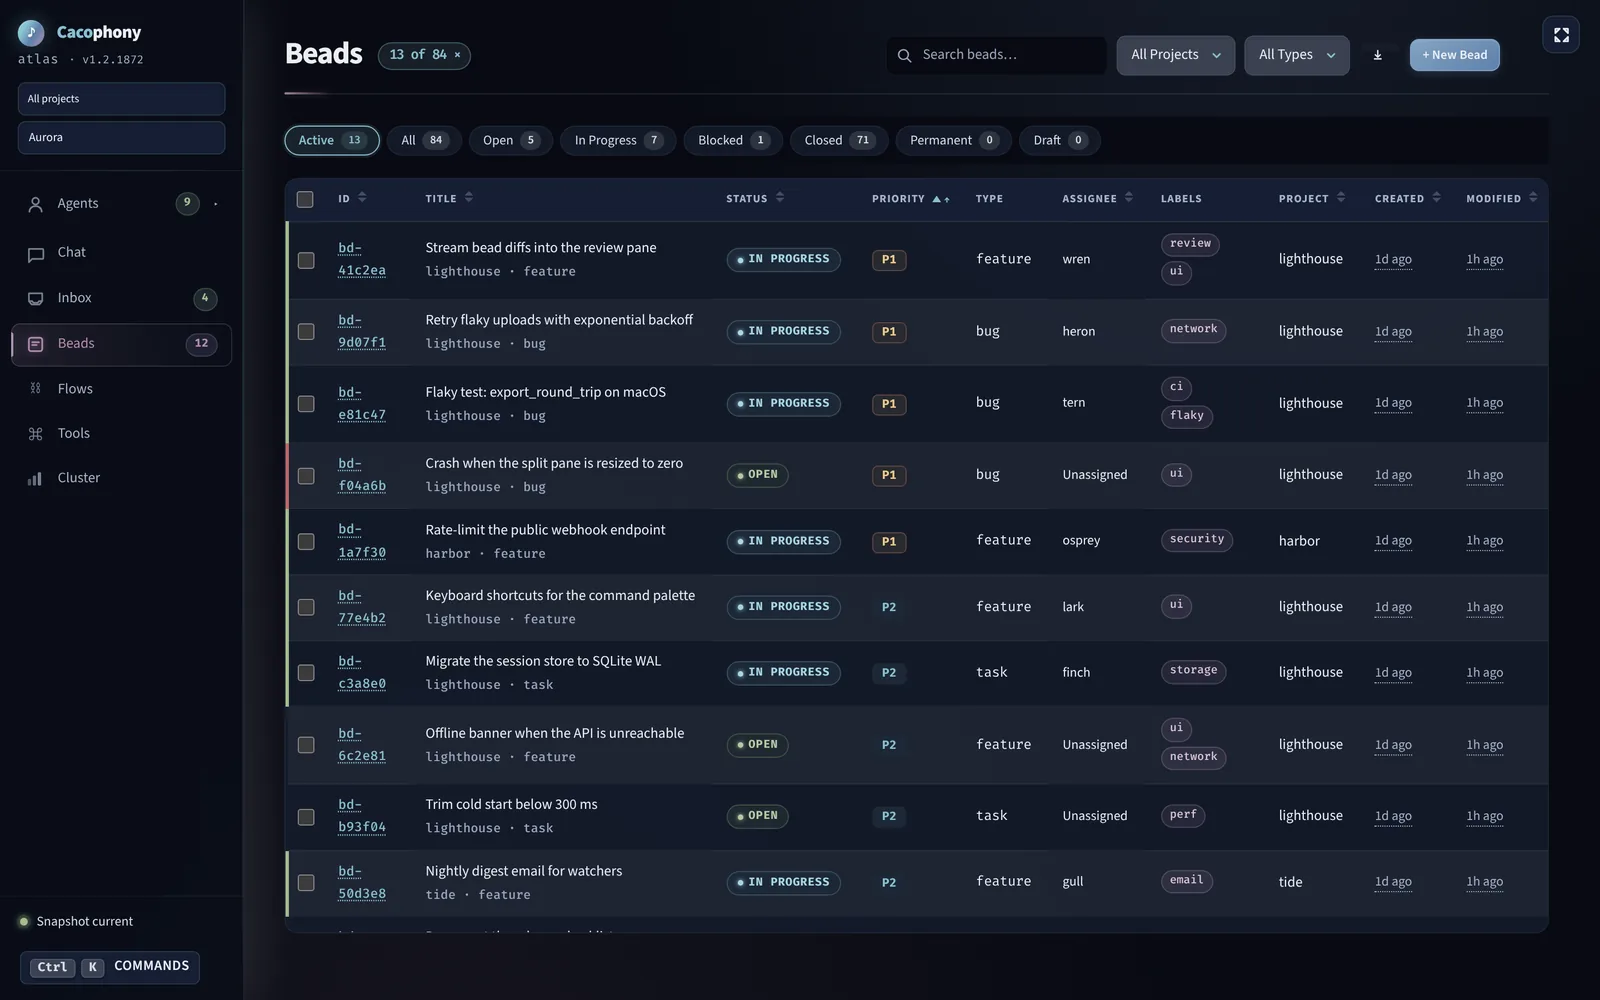
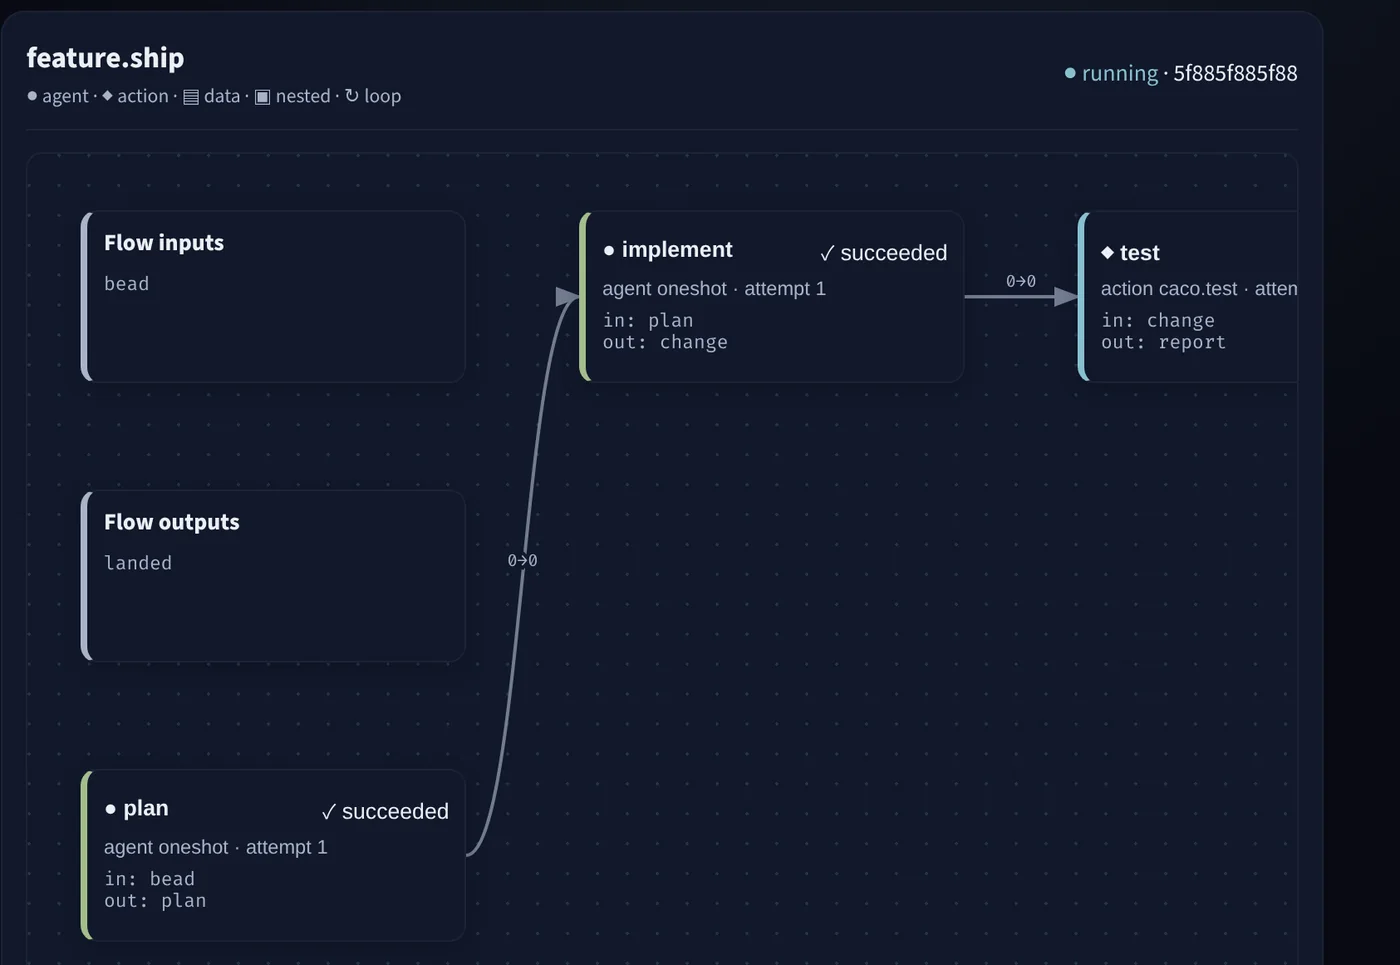
Entrypoints
| Route | Purpose |
|---|---|
/ | Dashboard overview, release/status cards, project and fleet summaries, plus top-level Inbox, Links, and other operational views. |
/workspace | Pane-based browser workspace for agents, beads, summaries, logs, source views, chat, and terminal slices. |
#tui / TUI navigation item | Persistent browser-hosted terminal for an operator-supplied agent running caco tui --project caco-web. |
/terminal.html | Standalone terminal surface used by legacy/detail flows. |
/notifications.html | Focused notification list for operator triage. |
Native desktop shell
Run caco ui for the native Linux or macOS application. It starts an app-owned dashboard on 127.0.0.1:11801, selects a free loopback port if that port is occupied, disables redundant browser authentication only for that private child, and terminates the owned server when the window exits. Existing dashboards selected with --web-server retain their normal authentication contract.
Use caco ui --serve to print the app-owned local URL for concurrent browser inspection. Use caco ui --web-server workstation:11180 or a complete HTTP(S) URL to skip local server startup and connect the native shell to an existing dashboard. Native shortcuts add Cmd/Ctrl+1…7 for the primary destinations, Cmd/Ctrl+L for project scope, and Cmd/Ctrl+, for theme selection without replacing the dashboard’s accessible browser shortcuts.
The Tauri binary is built as a separate Rust derivation, keeping GTK/WebKit build dependencies out of ordinary workspace checks. Linux packages install a freedesktop Caco UI launcher and icon. Darwin exports an ad-hoc-signed Caco UI.app with bundle identifier dev.cacophony.ui, a native ICNS icon, and the Mach-O caco-ui executable as its bundle entry point. The shell resolves caco from an explicit argument, a sibling executable, the nix-darwin system profile, the user Nix profile, the Cargo profile, or PATH. Its distinct identity does not overlap the native SwiftUI Cacophony.app. The manual-only Tauri desktop manual build workflow serializes Linux Nix build and headless lifecycle validation and never runs on pushes or pull requests.
Dashboard authentication
The dashboard authenticates with an httpOnly session cookie, not a bearer token embedded in the page. When the session is missing or expired (a 401 from the API), caco-web shows a Sign in overlay where the operator pastes the caco-web access token — the contents of $CACOPHONY_DIR/tokens/caco-web.token. That posts to POST /api/web/session, which sets the httpOnly cookie, and subsequent /api calls carry it.
For zero-config loopback launches, caco web prints a launch URL carrying a single-use ?token=<bootstrap>. The page strips that token from the URL synchronously before any network request (no Referer leak, no lingering in browser history) and exchanges it for the session cookie through the same /api/web/session endpoint, so the durable dashboard token never travels in a URL. A consumed, expired, or wrong bootstrap token falls through to the same Sign-in overlay.
Enforcement is default-on once the dashboard token and cookie-signing key are configured: an explicit CACO_WEB_ENFORCE_AUTH env wins (1/true enforces, anything else disables), otherwise the gate enforces whenever those credentials are present and stays inert when they are unset, so unconfigured/dev setups are unchanged. When enforcement is active, the daemon-proxy API surface (/api/*, except the /api/web/session login endpoint) and /metrics require a valid session cookie or the dashboard bearer and otherwise return 401; static pages, /health, and the login endpoint stay open. The dashboard surfaces that 401 as a distinct login-required connection state (the Sign-in overlay) rather than a generic disconnected/backend-unavailable banner, so an auth gap is not mistaken for a backend outage.
Dashboard Shell Controls
- The main dashboard includes visible desktop and mobile fullscreen controls. They use the browser Fullscreen API, update their labels and
aria-pressedstate when entering or exiting fullscreen, and remain compatible with Esc or browser-native fullscreen exit gestures. - Fullscreen mode applies to the dashboard application shell rather than a single chart, so Status, Agents, Beads, Nodes, Summaries, Workspace, and other views keep the same navigation and connection-state affordances in a roomier presentation mode. Modal overlays such as bead detail remain mounted inside the fullscreen shell so they stay visible and interactive, the fullscreen element paints the same ambient dashboard background as the body, and the fixed fullscreen toggle leaves header text usable on desktop while mobile uses the top-bar control.
- The Agents navigation item owns an accessible submenu for Active, Failed, Completed, All, and Artefacts filters; the submenu is nested inside the parent nav item so keyboard focus, screen-reader grouping, and sidebar styling stay consistent. Agent detail controls intentionally expose Complete rather than a direct Reintegrate button until the daemon has a browser-safe reintegration route, so the web client does not call a missing
/api/v1/agents/:id/reintegrateendpoint. - Phones and accessibility:
- The mobile menu traps focus while open, restores it on close, and stops the page behind it from scrolling; dialogs trap focus and Escape closes overlays.
- Services tables drop secondary columns on narrow screens, and iOS doesn't turn dashboard numbers into phone links.
- Inputs set the right keyboard, autocorrect and enter-key hints for identifiers, search, messages and prose; the chat length warning is announced politely.
- Landmarks, table headers, sortable columns, status indicators and loading panels are labelled for screen readers; decorative icons and terminal graphics are hidden from them.
- Action failures show a toast instead of a blocking alert, images reserve their space before loading, and timers pause in background tabs.
- Every page works without JavaScript enough to explain itself, isn't indexed by search engines, and respects
prefers-reduced-motion; full-screen terminals size themselves around mobile browser chrome.
- The Beads toolbar has a sort control beside the filters: choose Priority, Created or Modified (or another column), and the direction button reverses the order and says it in words, such as "Newest first". It stays in step with the sortable column headers, so it still works on phones, where the date columns are hidden. Workspace Beads panes have the same created/modified sort, applied before their 200-row cap.
- Small details that add up: tab titles show unread counts and the current view; filters, sort order and time windows live in the URL, so a refresh or a shared link restores the same view; each view remembers its scroll position for the session; Enter never fires mid-IME composition; heavy lists render lazily; and reduced-motion, reduced-transparency and high-contrast preferences are honoured (a sharper 3 px focus ring, opaque surfaces instead of blur). l opens the Links browser, and Shift+P opens the current workspace project.
Nodes View
The dashboard Nodes section is the browser member of the shared caco-web, TUI, Android, and native macOS Nodes contract. It exposes top-level cluster navigation, keeps node selection in the URL hash, orders the local node first when known, and opens a node detail panel without leaving the dashboard shell. The daemon snapshot now includes a bounded topology projection derived from config, peer reachability, relay state, and beads-primary routing, so browser/TUI/mobile/macOS clients can share direct/relay edge data, active-primary markers, dynamic-node metadata, and truncation status without inventing separate topology models.
- Node detail shows daemon/routing/status fields from canonical node APIs plus cached telemetry, service counts, config/version metadata, and degraded or unknown freshness when a peer is stale. Node and agent cards/dots can receive transient browser-local effects from feed/SSE events for choices, beads, speech, health, messages, and agent/session activity; those effects are not persisted, are rate-limited, and degrade to a reduced-motion outline when requested.
- Agents are grouped under the selected node by project, with row actions that open Agent Detail or start a direct message.
- Node-scoped chat uses the canonical project message endpoints for visible fan-out to non-terminal agents on the selected node; it is not a separate messaging protocol.
Stats View
The dashboard Stats section renders the unified fleet stats aggregate from /api/v1/stats (the same endpoint the CLI, TUI, macOS, Android, and iOS surfaces consume) as raw figures plus charts. It shows the cluster compute/storage rollup with per-node CPU/memory/disk utilization bars and a sortable per-node table, fleet token usage by project with cached-versus-fresh input/output cards and composition, and bead throughput — closed-rate totals plus a closed-bead time-series trend (sparkline). A project filter narrows the throughput/token sections and a node filter narrows the per-node rows while the fleet compute rollup stays whole, and the window/bucket selection drives the throughput series. Filter and sort state is reflected in the URL hash so refreshes and shared links restore the same view. Operators can also export the current stats payload as a JSON download or the per-node compute table as a CSV download.
Workspace Contract
window.Workspaceexposes the current pane tree plusbus.on()/bus.emit()for in-page pane coordination.- Browser persistence stays under the
workspace.*localStorage prefix. - Opening an agent from an agents pane focuses or creates an in-workspace Agent Detail split instead of raising the legacy modal popup.
- The interactive terminal MVP uses
/api/v1/agents/<id>/pty. caco-web's PTY proxy manager tracks connected clients, keeps a bounded in-memory transcript ring, and counts daemon bytes for the structured/ptyroute. Workspace terminal panes yield all focused keystrokes to xterm while preventing browser accelerator defaults such as Ctrl-W from closing the tab, keep their WebSocket alive for a 30-second idle window across SPA navigation, can float/pin as fixed Nord-glass overlays, and Agent Detail terminal actions reuse or focus an existing embedded terminal pane for the same agent before opening a new one. The standalone, Agent Detail, workspace, and TUI-sidebar terminal surfaces share an explicit ANSI base/bright palette plus thecaco.terminal.lineHeightlocalStorage default (1.2, clamped 0.8–2.0) where applicable, and the standalone terminal supports Nord/ANSI theming, font-size and line-height query/localStorage options, and web-link detection. - The web shell mirrors the dashboard degraded-state model in its compact status strip so agents, beads, and choices show delayed/unavailable instead of misleading zero counts. Bead counts treat only
status === "in_progress"as assigned, so legacy closed rows with historical assignee data do not inflate active-work totals. - Active unresolved choices are decision blockers: the Choices navigation badge counts only pending choices, turns red with an urgent ring while any are active, links directly to the choice-resolution view, and clears promptly when the first-party choices state reports no active choices.
- Persistent-agent summary cards render the declaration snapshot's own lifecycle state first (
running,starting,waiting,failed,stopped,pending, etc.) and showactive_agent_idonly as secondary runtime context, so failed or recovering declarations are not hidden behind generic active/idle chips. - The Remediation Diagnostics panel lists each finding's severity, kind, subject, age, summary and, where one exists, a safe next action, showing the first 50 and how many more are hidden. It is read-only.
caco remediation statusprints the same rows ([severity] kind(subject) summary, or--json), filtered by--healthy,--idle,--frozen,--rate-limited,--stuckor--zombie; unknown kinds are always kept. - Relative-time chips open an age-details popout with relative age, ISO timestamp, copy actions, and refresh.
- The active-agents dot grid and distribution bar use distinct lifecycle colors for queued, pending, recovering, waiting, stale, and blocked states instead of collapsing every unknown/transient state to the same faint color as stopped agents.
Chat Composer Loops
The dashboard chat composer uses the live agent list for @ agent-username suggestions; workspace chat panes request include_body=true for reader views and render message/file attachments as chips; selecting a suggestion inserts the mention token while send/routing semantics remain part of normal chat submission. It also shows local send-state feedback: an in-flight send remains visible as pending, successful acceptance is replaced by the canonical message row, and pre-accept failures remain visible with manual retry/failure affordances instead of vanishing. It also understands /loop <interval> <message>, /loop status, and /loop off as first-class slash commands. A browser loop captures the currently selected project, channel, and speak/broadcast/direct target at creation time, then repeats through the same message endpoints as ordinary chat sends. Project chat sends, retries, and loop creation treat the visible project channel as authoritative, so a channel such as #kittui cannot fall back to a stale default-project filter and broadcast to unrelated agents.
Use browser loops for operator-visible recurring nudges from the current chat context. Use the CLI caco loop surface for terminal-driven narration loops, and the Pi-native /loop mixin inside managed Pi runtimes.
Backend Health Semantics
caco-web and the daemon behind it can be healthy at different times: while a restart converges, the shell and /health answer but proxied daemon APIs fail. The dashboard says which situation it is in rather than showing healthy-looking zeros.
| You see | When | Behind it |
|---|---|---|
| Backend unavailable | daemon APIs fail during restart convergence, or the snapshot upstream returns 500, 502 or 504 | a 200 OK sentinel with error:"daemon_proxy_upstream_error" and X-Caco-Upstream-Status |
| Snapshot delayed | /api/v1/ui/snapshot exceeds caco-web's short backpressure budget | a 200 OK sentinel with error:"daemon_proxy_timeout", backend_unavailable:true, upstream_status:504; it retries |
| Cached state · reconnecting, with a stale badge | the live stream has failed for longer than a 15-second grace | the last known rows stay visible; pages with nothing cached fall back to disconnected |
| Agents delayed, Beads unavailable … | the same states, inside workspace panes | never shown as an empty search result |
| Loaded Beads, in warning colours | the snapshot has no bead_stats | the count is rows loaded, not the board total; caco bd status is authoritative |
| Summaries unavailable, retryable | a summaries read takes longer than 12 seconds | the proxy gives up rather than holding a daemon handler open |
- One upstream per process: a shared stream broker lets every browser tab and native client reuse one daemon
/api/v1/ui/streamsubscription, and a shared snapshot cache stops tabs forcing their own full-state grabs. If the snapshot path fails, caco-web can serve the daemon's last-known-good fleet snapshot, marked stale, before falling back to sentinels. - Visible reconnects: an upstream stream cut after its headers becomes a handled
daemon_proxy_stream_errorevent rather than browser console noise. - Instant feedback: a bead create, update, delete, claim, unclaim, close or dispatch updates the page from the mutation's own response; the stream and later snapshots reconcile it.
- Summaries: the viewer paints the first page, including any inline
first_detail, and fetches more only on Previous or Next; malformed or missing summaries are logged and the rest stay visible. The project filter takes comma-separated names, each a removable chip.
Persistent caco-web Development Loop
The shipped caco-web persistent profile is intentionally active rather than idle. On each wake it should inspect inbox and ready browser-dashboard beads, coordinate ownership of any existing local dashboard listener, run a real browser audit, file or claim focused defects from evidence, validate targeted fixes, commit all bounded artefacts, and reintegrate with caco agent reintegrate --mode direct without terminating the persistent agent.
- Scan and scope. Check assigned work plus ready/open beads mentioning
caco-web,caco web,browser,dashboard,workspace,summaries,visual-polish, orplaywright. Claim exactly one clear caco-web implementation bead, or continue the observation loop when no suitable bead exists. - Own one dashboard instance. Inspect
caco web status, listening processes, and recent handoffs before launching anything. A healthy listener without a managed PID is evidence for the lifecycle tracker, not a reason for this agent to kill or restart services. - Allocate artefacts first. Create a stable pending directory such as
.cacophony/agent/<agent-id>/summary/pending/web/before driving the browser; direct reintegration assigns the finalsummary/<NNNN>/state-branch path. Store the observation log, server log, audit markdown, screenshots, console logs, network evidence, and notes there. - Drive the real UI. Prefer
cargo run -p caco-web --bin caco-web-observe -- --url http://127.0.0.1:11180 --comprehensive --out ... --server-log ... --audit-md .... The comprehensive pass visits Status, Agents, Beads, Feed, Chat, Nodes, Services, Projects, Choices, Notifications, Actions, Logs, Timeline, Summaries, Workspace, narrow and wide layouts, and every Workspace pane type. The observation log records served web/healthversion, proxied daemon/api/v1/nodeversion, and daemon URL; if it prints a version-skew warning, interpret failures as live-daemon/served-asset evidence rather than checkout source proof until the runtime is refreshed. - Show what changed. Post the screenshot set to the kitty preview area for operator review, then summarize console/network status, served version, daemon version, PID ownership, Workspace copy, and whether the pass exposed a source defect or only operational/restart-window evidence.
- Fix only focused browser-dashboard defects. File one bead per distinct issue with reproduction steps and artifact paths, claim it, implement a small source fix, run targeted validation such as
cargo check -p caco-web --all-targetsandcargo test -p caco-web --lib, rerun the focused Playwright proof, and close only after reintegration lands. - Land every cycle. Observation-only cycles still write
summary.md, commit the summary directory and curated artefacts, rebase if main advanced, and reintegrate directly. The persistent agent then returns to the web loop unless the operator explicitly asks it to pause.
Live-DOM Validation Tooling
The browser dashboard is a single-page app with an open Server-Sent-Events stream, which gives the live-DOM validation tooling a few sharp edges worth documenting so caco-web specialists do not re-derive them each session.
- Do not screenshot the live SPA with raw headless chromium.
chromium --screenshot(and virtual-time budgets) hang on the running dashboard because the open SSE connection never lets virtual time complete. Use the staticcaco-web-dev-server(servescrates/caco-web/staticfrom disk and proxies/api/*) plus@playwright/cliinstead:cargo run -p caco-web --bin caco-web-dev-server -- --port 0. - Point Playwright at the nix chromium explicitly.
@playwright/clidoes not auto-detect the Nix chromium on NixOS; exportPLAYWRIGHT_MCP_EXECUTABLE_PATH=$(command -v chromium)(and keepTMPDIRshort so the daemon socket path stays within the OS limit) before driving it. - The DOM-eval subcommand is
eval, notevaluate.@playwright/cli ... eval '() => ...'works;evaluatefails withUnknown command. - Pick the right driver.
caco-web-dev-serveris static (no rebuild) and best for fast static-asset/CSS/JS repros;caco-web-observeis cargo-built, launches its own dev-server, is SSE/route-aware, runs the--comprehensiveall-route pass, and supports the--contrast-only --wallpapercompositing a11y audit. Reach for the dev-server for pure static-asset repros and observe for the comprehensive evidence pass. - Pico/streaming validation has a live-agent-free path. Drive it through the global
applyPicoEventhook pluswindow.renderPicoFixtureSnapshot()andwindow.cacoPicoDebugStats()acrossrequestAnimationFrameflushes, rather than needing a live agent attached.
Service Management
Use caco web status for the dashboard service itself.
It checks the configured dashboard ownership mode, standalone PID when applicable, local /health, and served-version drift from the current CLI/package version.
- One owner: Exactly one owner may bind the dashboard port:
services.caco-web.mode: standalone(the default) means lifecycle owns a separate PID-onlycaco webprocess and the main daemon must not bind that port;mode: embeddedmeanscaco-daemonowns the dashboard port and standalone caco-web spawning/watchdog supervision is disabled. - Standalone mode: In standalone mode, if
/healthis healthy while PID tracking is missing or stale, the command reports a stale/external-listener warning and includes the listener PID when the platform can identify it. If the standalone dashboard port is held bycaco-daemon, the warning is explicit (listener_kind: embedded_daemon), lifecycle state is degraded, andcaco up/ watchdogs refuse to spawn a duplicate standalone listener. - Embedded mode: In explicit embedded mode, the same daemon-owned listener is the healthy running owner and does not produce stale/external-listener warnings; version drift points operators at restarting
caco-daemoninstead of respawning a child service. - Supervisor: Use
caco service statusfor the native lifecycle supervisor; the same healthy-listener / stale-PID case is reported as degraded or unhealthy rather than simply stopped. The lifecycle watchdog treats standalone caco-web as a static external-port PID-only service: absence of a TTS-style dynamic port file is not a reason to kill it, stale-port cleanup must not kill the active caco-daemon listener, and/healthversion drift makes stale standalone dashboard assets eligible for respawn.
Visual Design
The Pages docs mirror caco-web's visual language: dark Nord tokens, the same semantic CSS variables, 8px card radii, subtle borders, and short hover transitions. The webapp stylesheet remains the source of truth for tokens; the docs site keeps a lightweight curated stylesheet rather than copying the full dashboard CSS bundle.